
Figures 1 and 2 below show histograms for the eight swear/taboo word forms analyzed according to specific procedures, grouping the normalized frequency data into bin intervals with a width of about 3.3. The X-axis displays the normalized frequency values, while the Y-axis shows the number of texts that fall within a bin interval. Figure 1 is based on all values in the dataset, while episodes with zero occurrences of a word form are not plotted in Figure 2.
Figure 1 shows that for the forms ass, bitch, damn, fuck, fucking and shit, there are about 50 or more texts that contain zero instances or very low frequencies. This is seen in the high bars on the left-hand side of each chart. Figure 1 also illustrates that there is an extreme outlier in the use of fucking (with a normalized frequency higher than 80, while the other frequency ranges fall below a normalized frequency threshold of about forty). In addition, it is apparent here that god is the only form for which the lowest frequency interval doesn’t dominate the rest of the data in the histogram.
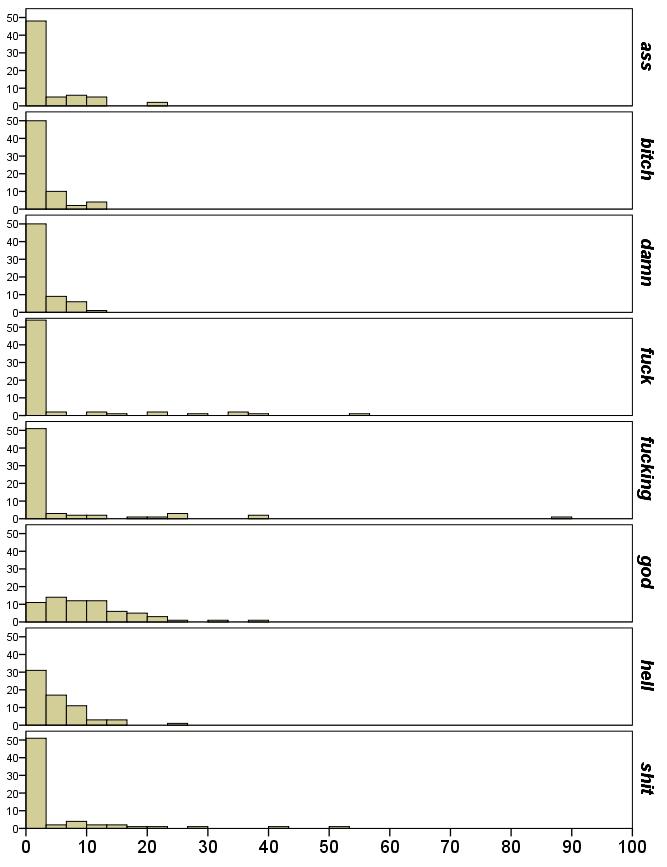
Figure 1 Eight swear/taboo word forms (histograms, includes zero occurrences)
We will now consider the dataset when zero occurrences are excluded, like in the boxplots. Figure 2 shows the respective normalized frequency ranges only for cases where a form occurs at least once in an episode. It can be seen that for bitch and damn there are a large number of texts with low frequencies. Hell, shit (and to some extent ass) also show more texts with low normalized frequencies (higher columns on the left-hand side), with fewer texts with higher frequencies. God has a broadly similar distribution pattern in both Figures 1 and 2, so there aren’t many episodes with zero occurrences of the word form. God also has the closest to a normal distribution (bell curve). In contrast, the distribution of columns for fuck, fucking and shit indicates that the usage is not tailing off as much. Fuck in particular shows steady usage across ranges of normalized frequencies. Again, we can see the extreme outlier in the use of fucking.
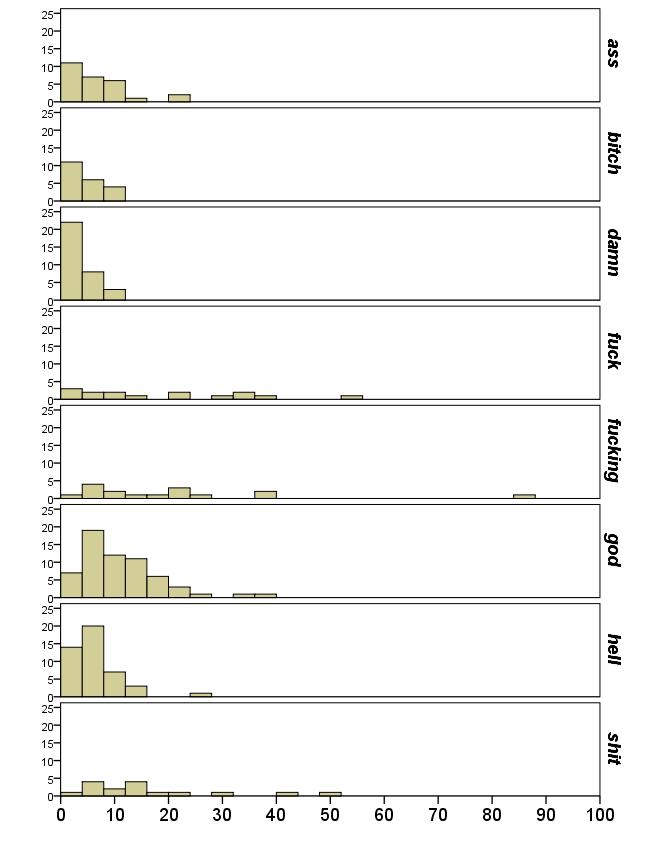
Figure 2 Eight swear/taboo word forms (histograms, without zero occurrences)
In sum, the histograms (and the boxplots) show that there is a considerable amount of variation in the data (between episodes) and that different swear/taboo words behave very differently. Generalizations about all swear/taboo words in TV series should not ignore or downplay such variation.