Introduction
The Kaleidographic Visualisation of Swear/taboo Words is a visualisation of my analysis of eight swear/taboo word forms in SydTV. Each file in the corpus represents dialogue from one episode of 66 different series. The corpus was sub-divided into files that come from ‘censored’ distributors (governed by rules regulating and limiting the use of strong swear/taboo words) and those that come from ‘uncensored’ distributors (not governed by such rules, e.g. HBO). I used corpus linguistic software to analyse the following word forms: god, hell, damn, ass, bitch, shit, fucking and fuck. The analysis focused on how frequent these word forms are, which patterns and phraseologies they occur in, and how widely they are distributed, both within and across the two datasets. To enable comparison, two visualisations (one for each dataset) are placed underneath each other. Together, these visualisations allow users to experience different types of information: frequency and distribution of particular word forms; clustering/co-occurrence of forms in a file; variation between the two datasets; variation between files within a dataset. Not all instances were included in these counts, and I recommend you read about the methodology here. The visualisations demonstrate that swear/taboo words are much more prevalent in uncensored TV series, but also that the variation in usage is wide. A video introduction to Kaleidographic is provided at the end of this page.
Instructions
By pressing ‘play’ you can watch the Kaleidographic visualisation scroll through the analysis, showing the results for each text in turn (Cycle number).
colour
Individual segments are ‘coloured in’: Each word form is represented by a different color, with less saturated colors representing low frequencies, and more saturated colors representing higher frequencies (based on a percentage of the maximum normalized value). When there are zero occurrences of the form in the text, segments in the visualisation are white in the old version and black in the current version of the visualisation (updated March 2019).
speed
If you speed up the player (sliding the speed widget to the right), you get a more holistic view of the frequencies of word forms and which ones tend to co-occur. Alternatively, you can manually scroll through each corpus file (using the ‘next’ button) and explore the combination of word forms in each text in turn.
Applying filters
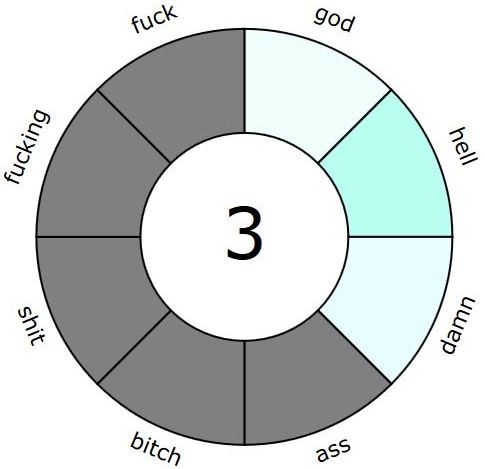
If you are interested in exploring specific word forms, you can grey out those segments you are not interested in (by pressing CTRL+Click in the segment you want to eliminate) and then hit ‘play’ to see the word forms you are interested in. Figure 1 is an example showing only god, damn, and hell (in the old version of the visualisation).

Figure 1 Example with ‘inactive’ (greyed out) words
Video introductions to Kaleidographic:
The following video, by Helen Caple, offers further explanation of the functionality of Kaleidographic visualizations (using an example analysis from another project).
This video explains how to create your own visualization using the Kaleidographic Builder Tool:
This video explains how to upload your visualization files to a server and view in a web browser.
For more on Kaleidographic visualisations and to create your own, go to www.kaleidographic.org. (The motivation for creating Kaleidographic is explained here.)
